
There are some indisputable truths on PPC measurements that any practitioner can relate to:
- There is no shortage of PPC metrics available.
- There is no shortage of PPC metrics that will be of zero use to the optimization of your campaigns.
- There is no shortage of debate among PPC practitioners about which metrics matter and which ones don’t.
- PPC campaign objectives will dictate which metrics need to be reviewed and analyzed.
- To truly optimize a PPC campaign, there is never just “one metric” and you always need to dig deeper to find your way forward.
- So many people who run PPC campaigns have no idea where to start.
This post does not contain the “ultimate PPC KPIs” or a “definitive guide to PPC metrics”. Instead, see this as a useful starting point.
Looking at any one of these metrics alone will not give you the needed answers for optimizing your campaign, but at a universal level, each one can point you in the proper direction towards understanding:
- Why the numbers are what they are.
- What needs to be addressed.
The Most Important Google AdWords Metrics
Each marketing agency has its own unique set of Google ads metrics due to the personalized nature of its Google ad campaigns.
Every business has different requirements for their advertising strategy and copy, and every website produces targeted landing pages for their visitors.
The purpose of marketing agencies is to get the most value out of money spent on PPC ads and different search terms by optimizing the budget and distributing it accordingly.
PPC can have an immediate impact on sales, so it is important to keep track of the right metrics.
You cannot improve your digital marketing campaign performance without benchmarks and measurement. Choose metrics that will help increase ad clicks, leads and traffic for your client’s business.
1. Cost Per Conversion
At the core, this measurement is a very simple calculation:
Ad Spend / Conversions = Cost Per Conversion
- Cost per conversion metrics within Google Ads reporting. Everyone. It makes no difference whether it’s B2C retail, B2B manufacturing, ecommerce, local services, nonprofit, or another category.
You can tell which campaigns are not going well by looking at the cost per conversion.
- Which campaigns are outside of what you deem to be an acceptable cost per conversion?
- How does the cost per conversion goal vary by campaign or ad group?
- Which ones are bringing the overall average up or down?
Based on what you see here, you may decide to:
- Reallocate budget from an under-performing campaign to one that’s more worthy.
- Zero in and peel back the layers on an under-performing campaign (ad creative, cost per click, calls to action, landing page, etc.) and guide your short-term optimization focus.
- Perform a deeper analysis on why a successful campaign is working. Can that campaign scale and maintain performance? Is there a lesson to be learned and applied to other campaigns or ad groups? There may not be, you at least need to make the effort to confirm.
Not all conversions are equal. For example, something that would be valuable to someone who downloaded a whitepaper would be different than something that would be valuable to someone who requested a quote.
You should be willing to pay more for a customer wanting a quote because they are more likely to be interested in your product. Remember that “cost per conversion” is not a one-size-fits-all concept for campaigns.
2. Conversion Rate
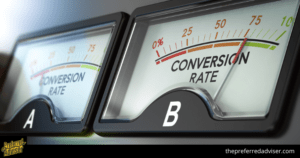
This measurement is also a simple calculation:
The conversion rate is calculated by taking the number of conversions and dividing it by the number of clicks the ad receives.
Everyone. It doesn’t matter if it’s B2C retail, B2B manufacturing, ecommerce, local services, nonprofit, or something else.
If you check your conversion rate from the beginning, you will be able to see how successful different campaigns are. Start with the lowest ones. What was their performance like in the current period in comparison to last month or last year? (If applicable.)
This number is important because it can help you improve your campaign.
Based on what you see here, you may decide to:
- Test a new Call to Action (CTA) on your landing page.
- Update the key messaging on your landing page. If it’s lower than it should be, there’s a disconnect somewhere. Remember that your ad copy “promised” something to the person who clicked through to it. The conversion rate is a direct reflection on how successful (or not) your landing page was at fulfilling that promise.
- Similar to “cost per conversion”, this metric points the way to a deeper analysis on why a successful campaign is working. Can that campaign scale higher? Is there a lesson to be learned and applied to other campaigns or ad groups? There may not be, you at least need to make the effort to confirm.
Again, not all conversions are created equal. Some goals are more difficult to achieve than others.
For example, it is much easier to convert someone to a free direct download of a trial version in the consumer software world than having a trial version that forces a user to enter personal information and a credit card up front that will automatically convert to a paid subscription after 14 days.
You will need to decide which method will lead to more customers paying.
3. Search Impression Share
The purpose of your ad campaigns should be to target a specific audience with a specific purpose or intention. Although this does not ensure that your ads will be displayed every time an opportunity is available, it is still worth trying.
In other words, if your ad has the potential to be shown 100 times, and it is only displayed 80 times, then you have an 80 percent chance that your ad will be seen by someone who is searching.
Everyone. It doesn’t matter which category it is, whether it’s B2C retail, B2B manufacturing, ecommerce, local services, nonprofit, etc. (Notice a pattern here?)
This is not the first thing you should examine, but it should be given high priority and be a central part of your investigation. You want your ad to show up for every applicable opportunity and to have a high success rate.
A couple of common factors that play into this are:
- Budget allocation (see below in #4).
- Quality Score: Many studies, blogs, and conference presentations have covered (and debated) quality score in depth so I won’t here, but generally speaking, you can be reasonably confident that having a high-quality score is never a bad thing.
The highlighted line in the graphic below shows different metrics than the one directly above it.
The “search impression share” is 63 percent. This is the most expensive option in terms of cost per click, total cost, and cost per conversion. If you examine the cost per conversion first, you will see that this segment is worth investigating further.
Some of the things this examination could lead you to might be:
- Experimenting with your ad copy or the CTA’s given the low click-through rate (CTR).
- An analysis of the true value of these conversions. At $38.34 it’s the most expensive one. As stated earlier, not all conversions are created equal, so this one better be more valuable than the rest.
- Additional question: If these conversions truly are more valuable than the others, do you just need more budget or do you need to put intense focus into optimizing the path?
What works for your competitors won’t work for you. You have to test a lot of different strategies and see what works for your campaign. Don’t worry if it’s low when you first start. As you gain more data, be prepared to take action, but don’t be discouraged if the numbers aren’t as good that first month.
4. ROAS or Return on Advertising Spend
This AdWords metric displays the return on investment (ROI) from your ad campaign. This metric will give you an idea of how your ads are performing.
ROAS is calculated by dividing the amount of money spent on ads by the amount received. This metric measures how well your advertising campaign is performing. To calculate your return on investment, you need to track your sales and deals and determine where your leads and customers originated.
5. Quality Score
 This metric shows the quality of your ads. The Quality Score for a keyword indicates how relevant your ad and landing page are in relation to that keyword. This metric is based on how relevant your ad is, the likelihood of someone clicking on it, and how good your landing page is.
Quality Score is not the same for every keyword within one Ad group. If you have a high-Quality Score, that means that what you’re offering on your landing page is relevant to what your audience is interested in.
6. Reach
Reach reveals how many people have seen your ads. If you notice that your ads are not performing as well as you had hoped, take care in where you place them. It is important to keep the Search Network and Display Network separate.
7. Impressions by Campaign
The following metric shows the number of times your ads are displayed, segmented by each campaign you run. You may want to track this metric to find the best keywords and subjects with the ad inventory and volume needed for success. This will help you to make changes to your ad campaigns so that you can see the best results.
8. CPC or Cost Per Click

The metric ‘cost per click’ in AdWords shows you how much you’re spending for each click on your ad. This is important to know for the financial success of any pay-per-click campaign.
Your cost per click (CPC) is closely related to your return on investment (ROI). Therefore, you should examine your CPC in great detail. This metric will help you determine if you are paying too much or too little for clicks.
9. Cost
Ads that generate a lot of money are probably the best performing ads. You should be aware of your search ad budget and whether you’re making the most of it or simply wasting money on your search impression share.
You won’t make a profit if your costs are high, so it’s best to reduce waste in your AdWords account.
10. Clicks
This metric measures how often people click on your ad. It specifically counts the number of times people click on any linked text in your search or display ads. More clicks on your ad usually means that more people are coming to your site.
This metric can help you determine if your ad is appealing to your target audience and if you need to make any changes.
11. CTR or Click-Through-Rate
To calculate your CTR, divide your clicks by impressions. The AdWords metric lets you know how well your keywords, positioning, and imagery work together. Ad campaigns can be effectively communicated to potential customers through analyzing search engine data.
This data can help you understand how well your ad is being received and if searchers are finding it relevant.
If you have a high click-through rate (CTR), it means that your ad text and keywords are relevant to your target audience. A low CTR indicates that your audience is not engaged with your campaign.
12. Impressions
The number of times your ad is displayed on a Google search result page, based on matches between the keywords you use in your campaign and the terms and phrases within search queries, is known as an impression. Impressions are a critical AdWords metric because they provide insight into how often your ad is being seen.
Your ads must be shown to searchers in order to give them an opportunity to click on them and convert. In other words, you need impressions to get conversions. This metric is important to track regardless of what your goal or campaign type is.
Leading a branding campaign can help increase brand awareness by using a catchy slogan that will help customers remember your brand.
Conclusion
It is crucial to keep track of some of the most important AdWords metrics for the performance of your ad campaigns and return on investment. The metrics listed in the article can help you decide which strategies are working and which ones are not.
0 comments